

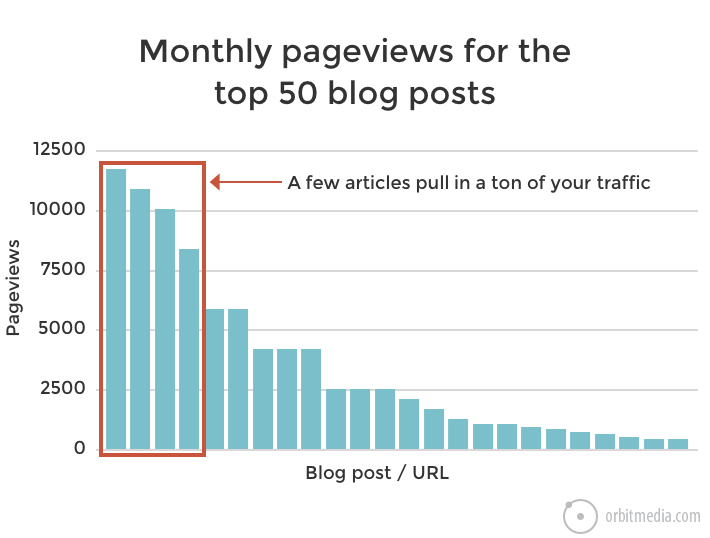
It’s the 80/20 rule of content marketing: 80% of results come from 20% of content. This is true for every website and for every content marketing audit I’ve ever done. A handful of articles pull in the largest percentage of traffic and conversions.
Just look at your own data. A report of your top posts by traffic probably looks something like this. A few posts bring in a lot of traffic, while most articles drive little or no traffic.
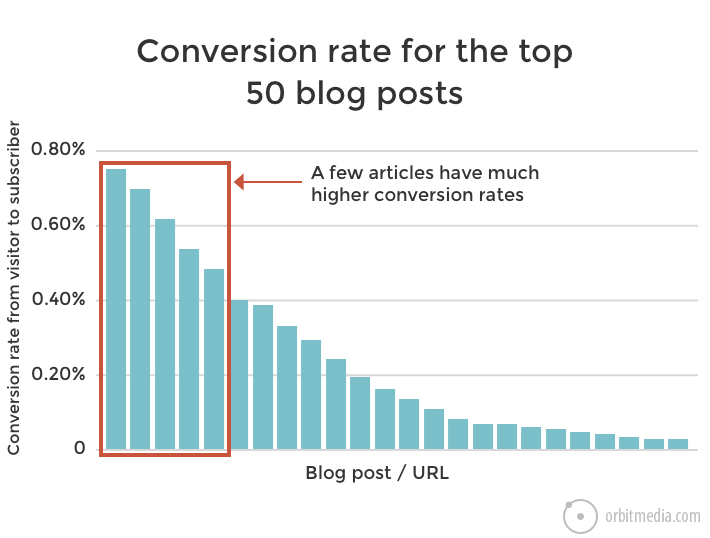
If you calculate the conversion rate for each piece of content, you’ll see a similar curve. A few articles convert visitors at a high rate, while most articles convert few or no visitors.
A Content Audit for Finding the Top Performers
If it’s true that 20% of articles create 80% of the results, then why aren’t we focused more on these performers? The problem is that we usually don’t know which articles are the real heroes. To find out, we need to do an audit.
Here’s our content audit checklist. Use the links below to skip to the sections you want. ✪ Advanced Readers: Skip down to section seven for the deeper analysis.
FINDING TRAFFIC CHAMPIONS
1. SEO: Content that attracts visitors from search
2. SEO: Content with declining search traffic
3. SEO: Content that has search ranking potential
4. Email: Campaigns that attract visitors
5. Email: Measuring the engagement of visitors from email campaigns
6. Social: Content that gets the shared the most
FINDING CONVERSION CHAMPIONS
7. Content that converts visitors into leads at the greatest rate
ACTIONS
8. What to do now that you know the strengths and weaknesses of each piece of content.
This is a step-by-step guide for auditing content marketing efforts. Once we’re done, we’ll know what’s working hard and what isn’t. We’ll also discover some new best practices for adapting our content marketing based on the analysis. Let’s jump in…
Note: This audit was all about optimizing content marketing activity. If you’re looking to redesign your website, we have a separate process for auditing content on high ranking websites during the website redesign process.
Finding the Traffic Champions
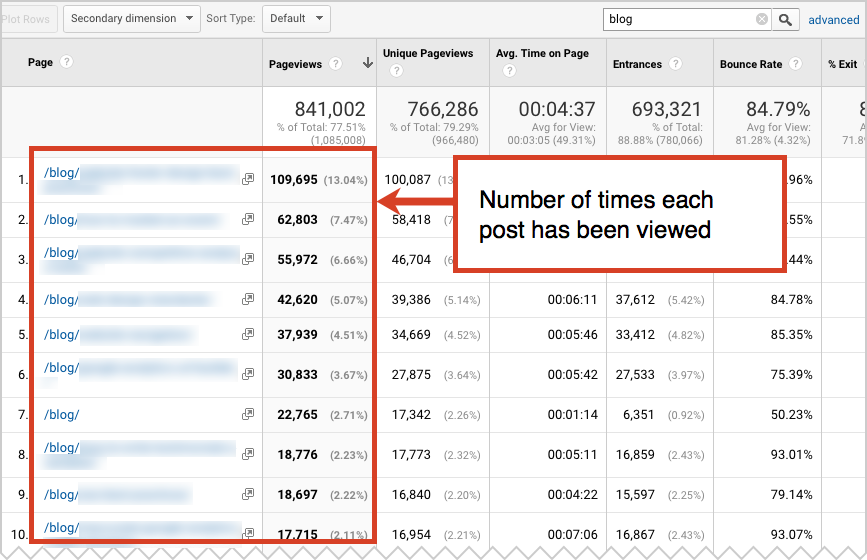
These pages and posts aren’t hiding. The pages that get the most traffic will jump out of your Analytics as soon as you look at your Behavior > Site Content > All Pages report.
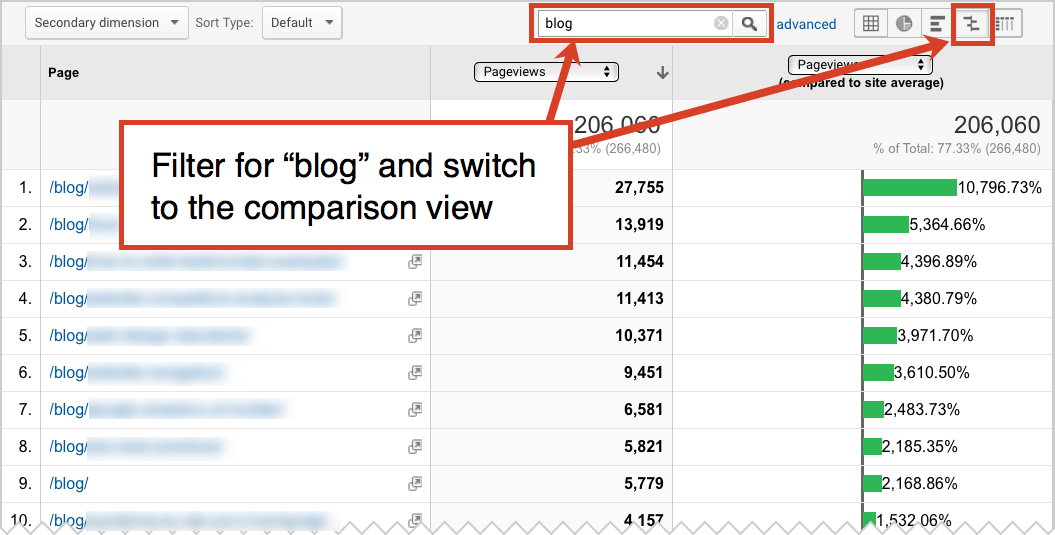
If your blog content is all within a directory (such as mysite.com/blog) it’s easy to filter this report to only see blog posts. Just type “blog” into the filter box. This is one of several ways in which your website can play nice with Analytics.
Switching this report to the comparison view makes the top performers even more obvious. In the example above, the top blog post is getting 10,800% more traffic than the average page. That is a traffic champion!
There are three traffic sources in content marketing: search optimization, social media and email marketing. Let’s make sure our content marketing audit covers all three.
1. SEO: Content that attracts visitors from search
Usually, the articles that get the most traffic are also the articles that rank well in search engines. But if your date range for the report includes recent email campaigns or dates when articles went viral in social, this may not be the case.
There are two ways to see just the content that gets traffic from search. One is to use a segment. Create a segment for search traffic (where the medium is organic) and it won’t include visitors who came from social, email, direct or anything else.
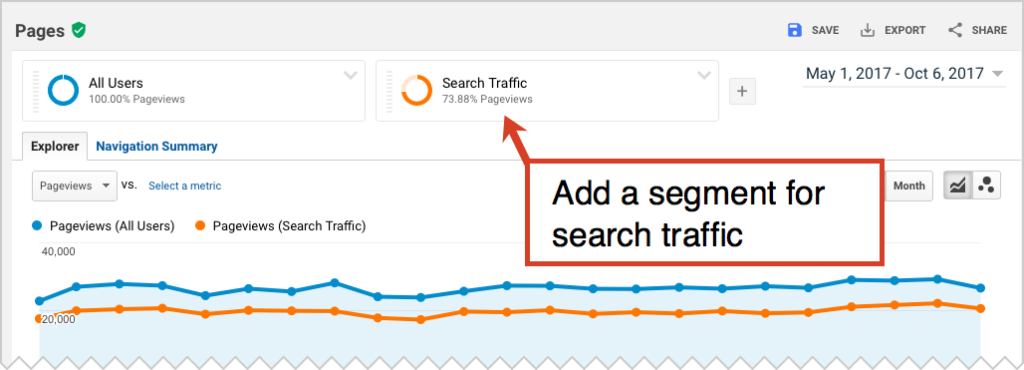
If you remove the “All users” segment, you’re just looking at visitors from search.
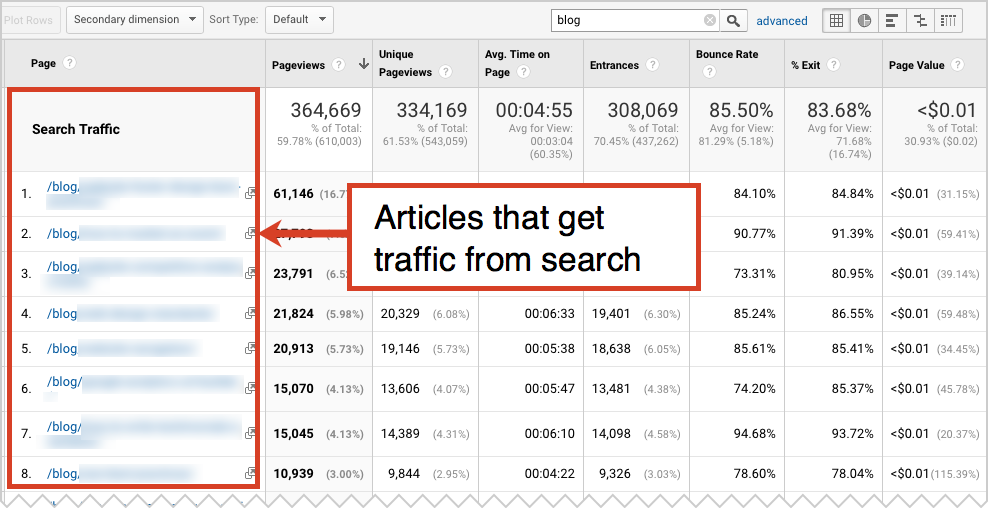
The problem here is that it doesn’t show you the search performance of each article. It shows the total traffic from search to pages, even when that article wasn’t the one that ranked and attracted the visitor. Visitors to these pages may have started their visit from some other page!
To see the which posts are ranking and attracting visitors directly check the Acquisition > Search Console > Landing Pages report. Just sort this report by clicks and you’re measuring content performance from search per article.
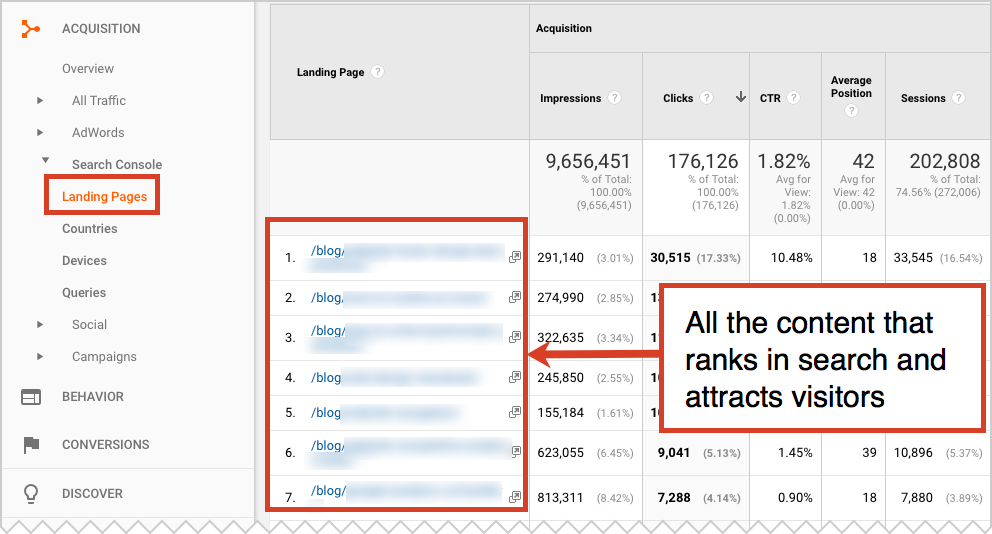
Note: This report isn’t available until you connect Analytics to Google Search Console (video instructions here). Also, keep in mind this report only shows data for the last three months.
These pages have durable traffic-driving power. In step two we’re going to drive more results from these pages. So make a list of these search ranking champs.
ProTip: To find the posts that are almost ranking high, and therefore have the greatest opportunity for improvement, check out our step-by-step process at the end of this post about SEO for blogs.
2. SEO: Content with declining search traffic
To defend your total, topline traffic, it’s important to monitor the rankings and search traffic of your traffic champs.
Google Analytics doesn’t track changes in rankings over time. But a tool like Moz will track the rankings of any keyphrase you provide. Tools like SEMrush and Ahrefs will track your rankings for everything automatically. No need to provide the phrase.
To see the changes in search traffic for any page, set a segment for search traffic (where the medium is organic search). Then set the date range to show a recent month and then an earlier month. The top of the report will look something like this.
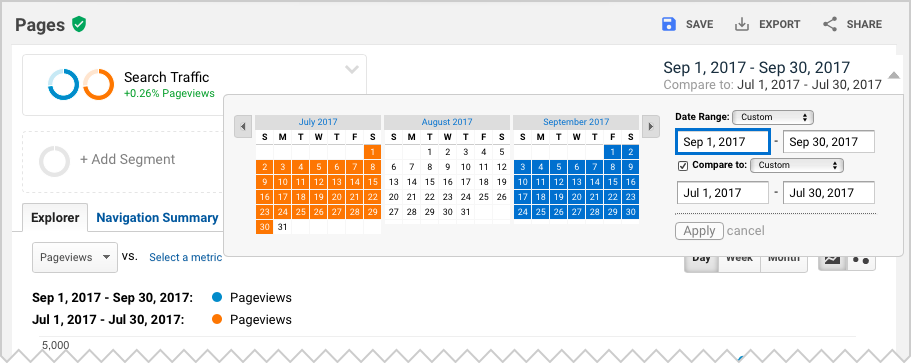
Scroll down to see the list of content. Now you’ve audited the changes in search traffic for your top articles.
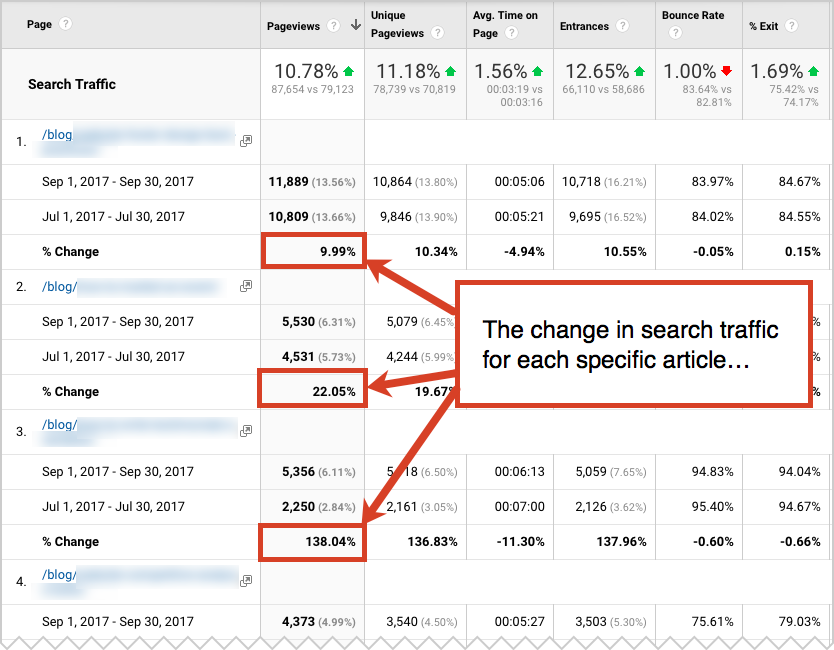
This is more useful than tracking rankings for specific phrases. Tracking rankings is nice, but what if it’s a low-volume keyphrase? Or what if there are other more popular phrases that page ranks for? If so, the ranking doesn’t really matter. So it’s better to audit the change in search traffic per page.
SEO is not really about rankings. SEO is about traffic.
Any of the pages starting to slip? If so, it might need a little help. Make a list of the pages with declining search traffic.
3. SEO: Content that has search ranking potential
There may be pages on your site that don’t rank themselves, but have the other kind of SEO value: other sites are linking to them. These are URLs with ranking potential that we might be able to leverage later. So the ideal content marketing audit will find these pages too.
There’s a free tool that shows you the number of websites that link to each of your pages. It’s Google Search Console. You can’t filter this for “blog” but you can export it to a spreadsheet and then filter it.
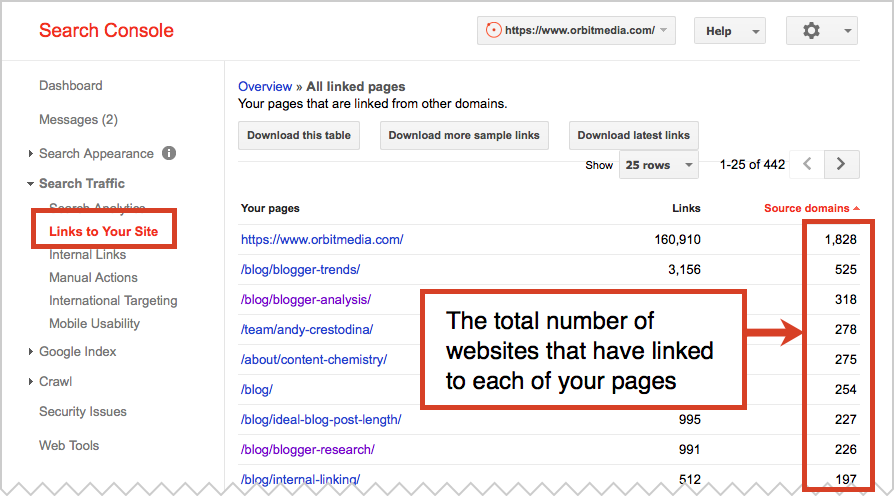
The problem with this data is that it treats every linking domain as equal. A link from MySpace and a link from the New York Times each count as one link. A better report would weigh the links and show the overall ranking potential of each piece of content.
Moz calls this ranking potential “Page Authority” and it takes into account both the quality and the quantity of your links. The report is in their (paid) tool in the Top Pages report.
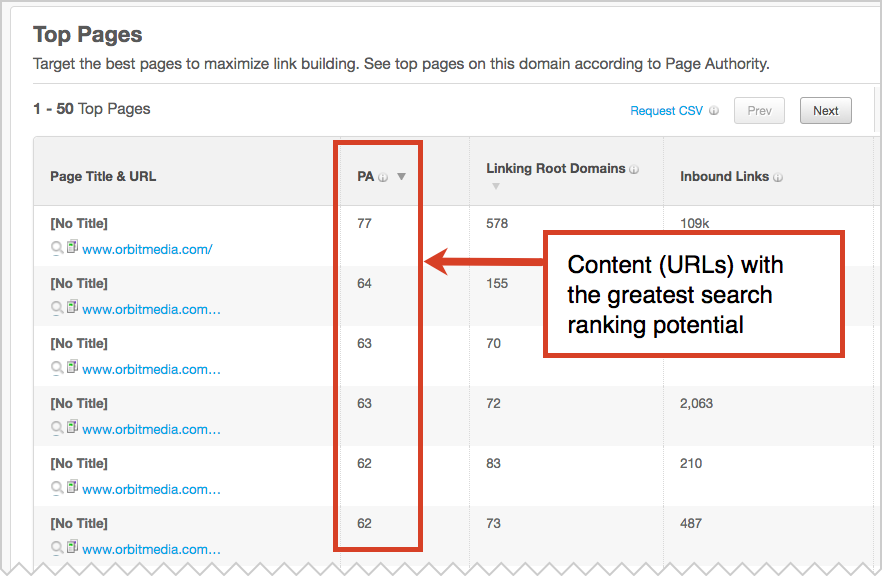
Note: A subset of this data is available for free and for any website, even competitors. This report is part of Open Site Explorer.
You may quickly notice that you have pages with good authority, but they don’t appear on the Landing Pages report. Interesting, right? Later we’ll drive more value from these pages. So make a list of these high potential pages.
4. Email: Campaigns that attract visitors
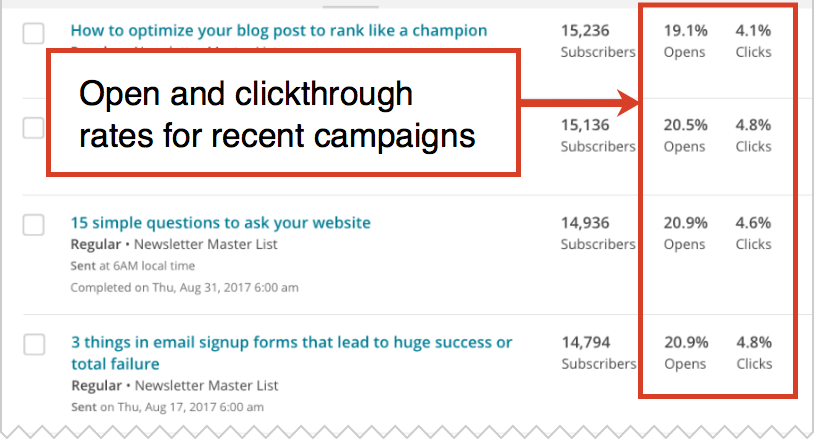
To find the email campaigns that get opened and clicked, check the reports in your email service provider (ESP). At a glance, you’ll see which emails had the greatest stopping power and connected with subscribers in their inboxes.
Assuming that deliverability is good and you’re sending email to people who want it, here are the factors that determine the metrics:
- Open rates are affected mostly by sender name, subject line and timing
- Clickthrough rates are affected by the above factors and also the call to action within the email
If you’d like to measure performance of the calls to action separately, without influence from the open rate, look for the “clicks per unique opens” metric. This is the percentage of people who clicked after opening the email.
5. Email: Measuring the engagement from each campaign
What your ESP doesn’t show you is who stuck around and read the article.
The performance of your campaign after the click is measurable only within Analytics. Assuming you’ve properly tracked your campaigns with a URL builder (or using the tools in your ESP) your path is: Acquisition > Campaigns > All Campaigns report.
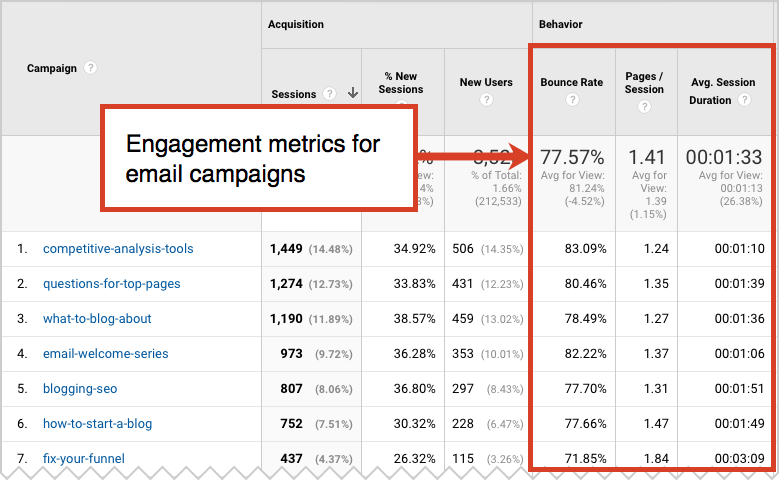
This report will show all campaigns, not just email, so you may need to sift through other data. And it shows all emails, not just content marketing emails. To measure the performance of purely promotional emails, you can find conversion rate in the columns to the right of the screenshot above.
I’ve never found any particularly revelatory insights here, except that landing pages with better internal links lead to higher pages per visit and landing pages with video get much higher time on page. Not surprising.
6. Social: Content that gets shared the most
This is easy to find, but there are lots of reasons the data may not be super accurate. Just put your domain into Buzzsumo and you’ll see the top shared content.
The top five are available for free and everything is available with the paid version. It’s a powerful content auditing tool not just for your site, but for competitive analysis.
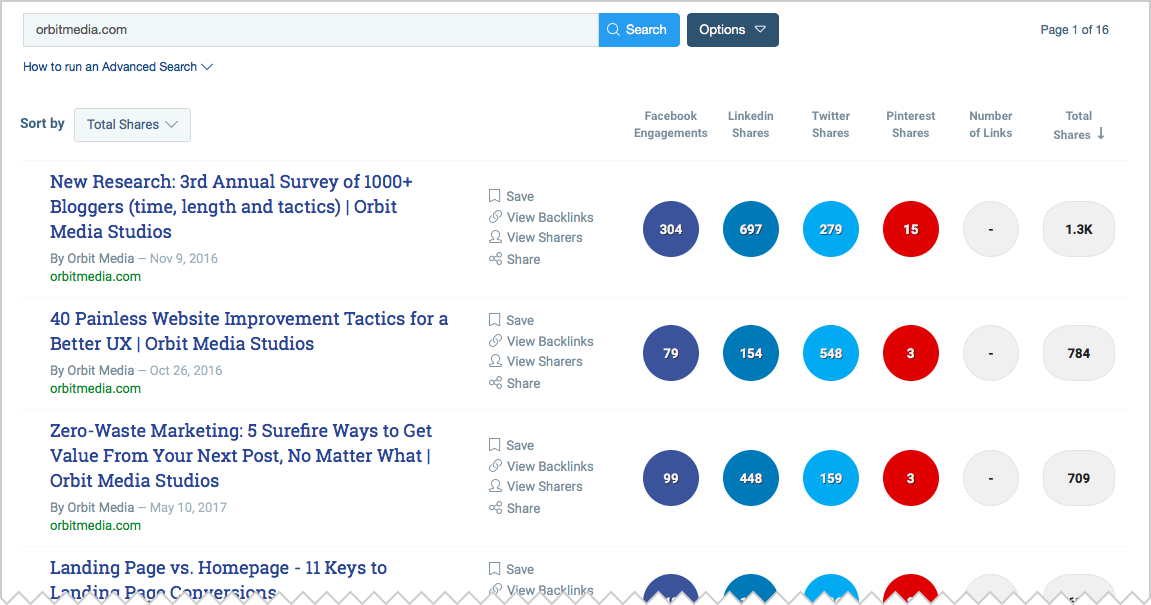
This is just one of many powerful reports available in the full version of Buzzsumo. But’s it’s an important part of any audit. Content that gets shared holds a lot of clues into marketing performance.
- Which headlines tend to perform well?
- Which networks are the most engaged with our content?
- Which collaborative efforts have been most successful? (influencer marketing)
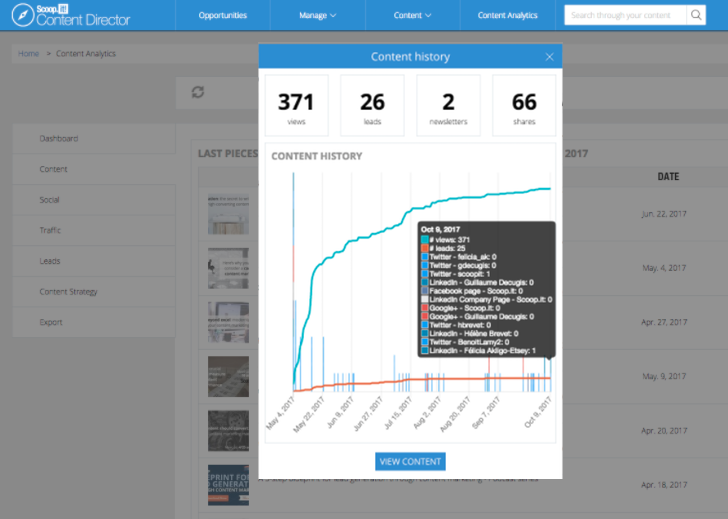
Shortcut! Let Scoop.it find sharable content and promote it for you.
Scoop.it has a Content Director that shows you social shares as well as conversions for all your content, then makes recommendations and automatically schedules social promotion based on what is getting traction where. Smart!
7. Finding the conversion champions
Some content is so helpful that it inspires visitors to take action and subscribe to get more. But most content does nothing at all to help grow your list. If you can find the hidden gems, you can put them on display and grow your list much faster.
So the next part of our content marketing audit is to find the conversion rate from visitor into subscriber for each of our articles. It’s a five-step process that might take a half hour. After we explain everything, we’ll show you a shortcut using a 3rd party tool called Klipfolio.
Note: This analysis assumes that visitors can subscribe to your newsletter directly from pages on your blog and that you have goals set up properly!
1. Set your date range in Analytics for at least a year. You need a lot of data.
2. Go to the Conversions > Goals > Reverse Goal Path report.
3. Set the goal to newsletter subscribers (or downloads or any of your other content marketing goals)
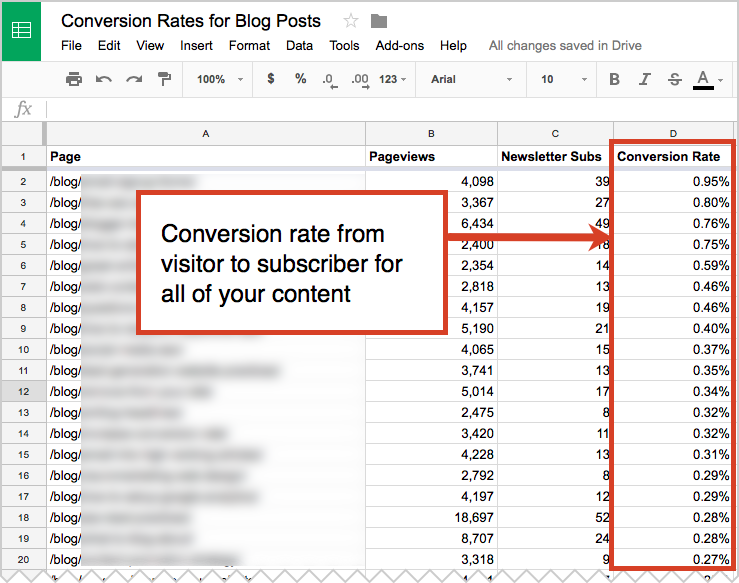
Now you’re looking at the number of conversions, from a visitor into a subscriber, for all of your content marketing.
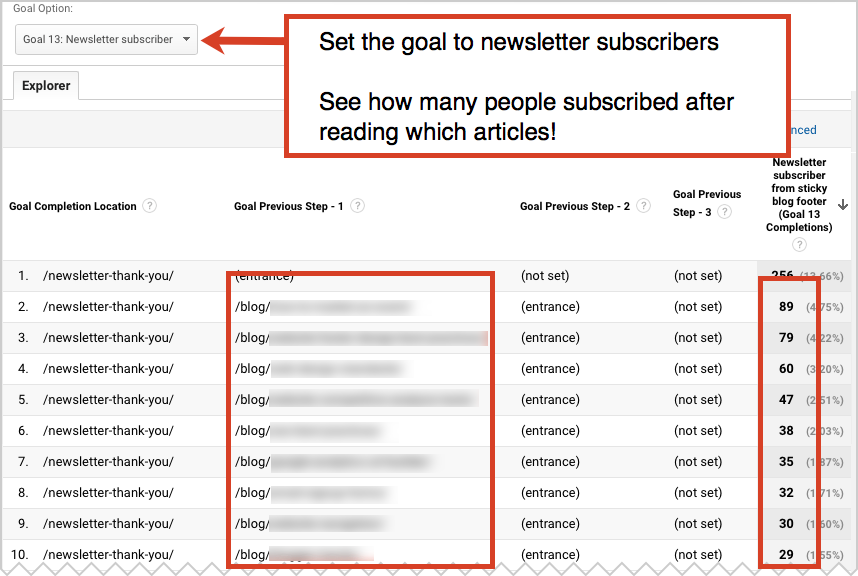
Note: If your visitors subscribe from a popup window without a separate Thank You page, the posts may be in the column on the left (Goal Completion Location). If visitors subscribe from a separate Subscribe page, the posts might be in the column to the right (Goal Previous Set – 2) Regardless, it should be obvious which post inspired the visitor to sign up!
Fun, right? But the problem with this data is that it shows the total conversions, not the conversion rate. Some of these articles may convert a few more visitors, but they may also get a ton more traffic. So we need to factor pageviews into our equation to see the actual conversion rate.
The next part requires a little math. There is no single report in Analytics that shows conversion rate per page, so this is a “calculated metric.” You’ll need to export the data from two reports above and combine them in a spreadsheet.
5. Export the data from the two reports and combine in a single spreadsheet. Divide conversions by pageviews in a new column. That’s your conversion rate!
Notice how even in the top 20, some posts convert 4x as many readers into subscribers. Scroll down through the top 50 and you’ll find posts that convert virtually nobody.
Shortcut! Let Klipfolio do the math for you…
Klipfolio is a tool that lets you build dashboards with data from multiple reports or sources. Even signing up for the free trial will let you connect your Analytics and get the data. Here’s what the report looks like:
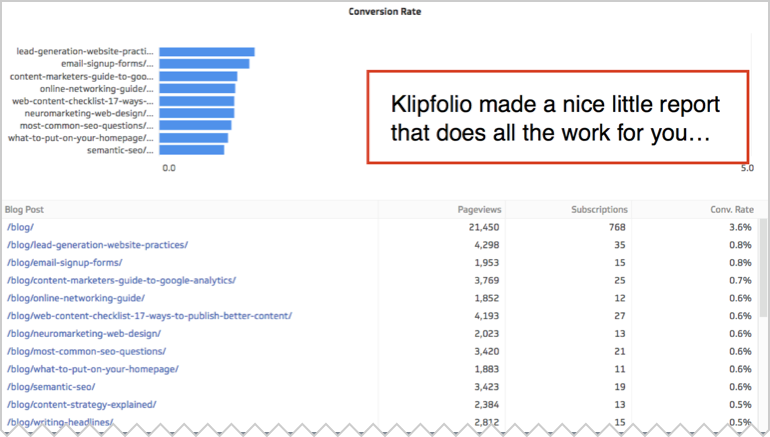
This is a pre-built dashboard, which makes things even easier. Thanks, Klipfolio!
Get the Klipfolio Content Marketing Dashboard >
8. We’re done with the content audit. It’s time for action!
Reports don’t affect your marketing. Only actions do. But the audit has told us exact where to act and how. Now that we know what’s working and what’s not, the actions we take will have a much higher impact.
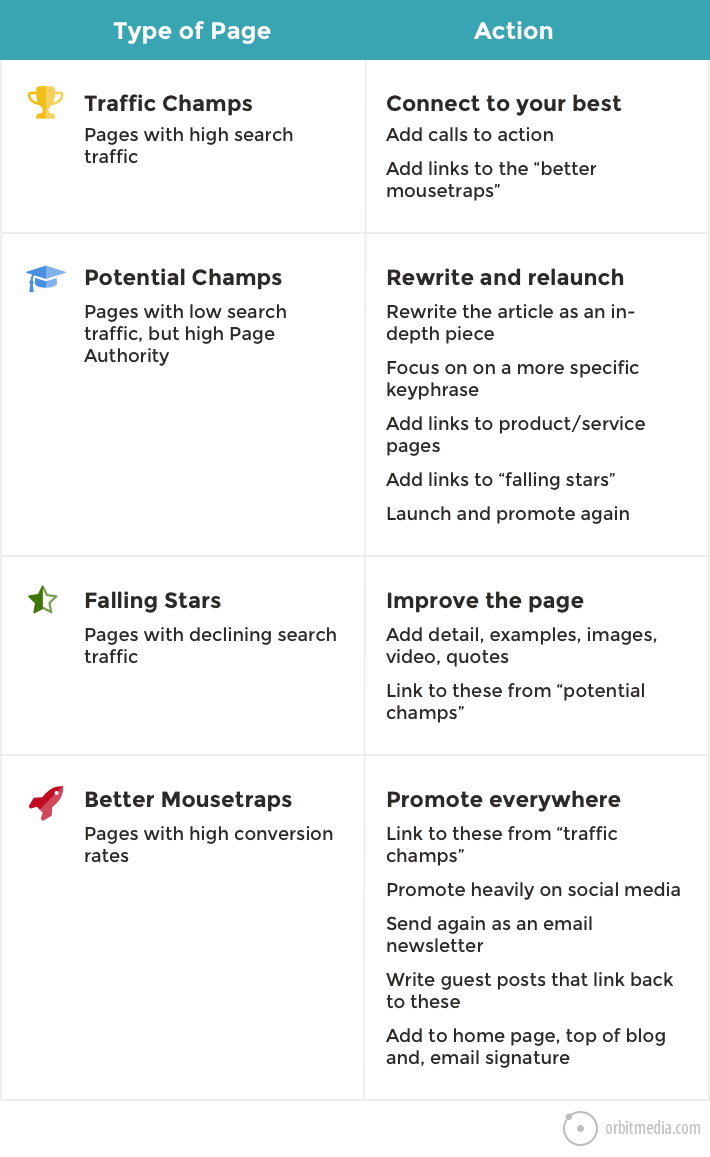
We’ve identified four kinds of pages, each of which will benefit most from a different kind of action.
TRAFFIC CHAMPIONS
- Type: High search traffic pages. Also (possibly) pages with high social shares and email open rates
- Action: Link from these to your highest converting pages with internal links and calls to action. Add “related articles” links at the bottom to posts on related topics with high conversion rates
POTENTIAL CHAMPIONS
- Type: Pages with low search traffic, but high link popularity / Page Authority
- Action: Repurpose the URL and rewrite the article. Make it a high-quality piece focused on a specific topic and keyphrase. Then relaunch the piece with a new email campaign and social promotion. Finally, use internal linking to pass SEO authority from these pages to products and services pages and to “falling stars.”
FALLING STARS
- Type: Pages with declining search traffic
- Action: These pages need help before they fall off into obscurity. Google is looking for the best page on the internet for the topic, so our first goal is to simply make it a better page. Add anything that improves quality, including details, examples, images, video, statistics, contributor quotes and answers. These pages also get a boost when you link to them from “potential champions.”
BETTER MOUSETRAPS
- Type: Pages with high conversion rates
- Action: Drive traffic to these pages by any means necessary. Start by linking to these pages from “traffic champs.” Then put them into heavy social rotation. Add them to your homepage. Put them back at the top of your blog. Add them to your email signature. Send them out again in email campaigns. Pitch guest posts that refer back to them. You can even buy ads to these pages or try them in native advertising!
Here’s a little chart that summarizes the actions and outcomes from the audit.
Yes, you’ll find clues into what topics work well and what to write next. But all the actions and outcomes from this content audit suggested here are about improving existing pages. Content genius Michele Linn makes the case for updating existing pages:
“If you are constantly focused on creating new content, I urge you to think again. Chances are, you have content that has done really well. Re-use that! You may think your readers will scoff at seeing something that they have read before, but honestly, how many of your readers read everything?”
– Michele Linn, Linn Communications
More juice from every squeeze…
That’s the purpose behind this process: to get the greatest potential impact from the smallest possible effort. Since there are so many possible actions we can take in digital marketing, an audit will focus our attention on the actions that matter most.
Final Step: Repeat this process every six months for best results.
This article originally appeared on Orbit Media Studios.


